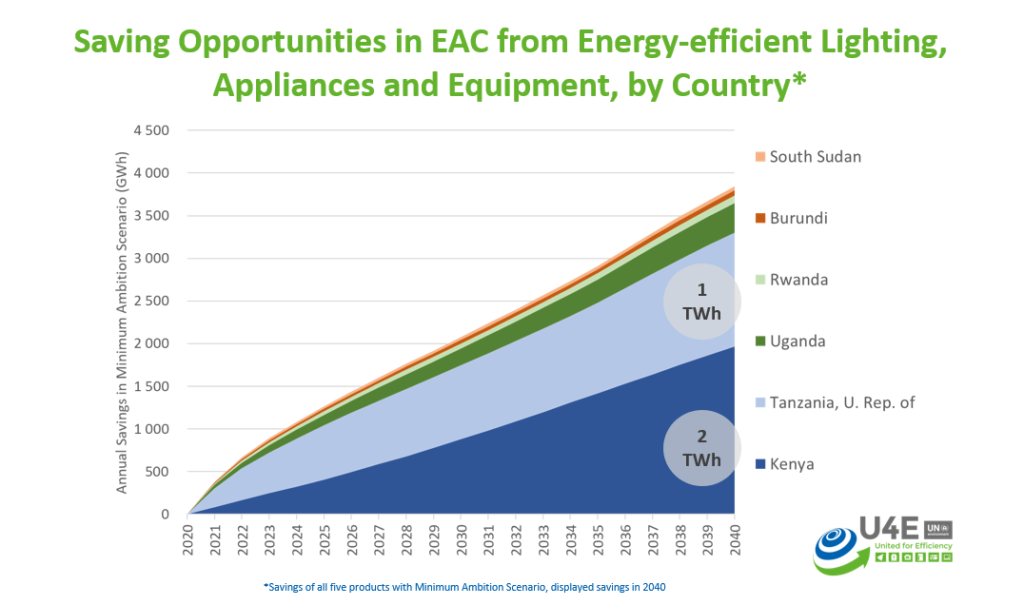
The graphs below provide an overview of the savings potential for the EAC region. They are based on the collated data from the U4E country savings assessments for the region.
The first graph shows the overall savings potential and illustrates three ambition targets – business as usual, minimum ambition and high ambition. The second and third graphs show a breakdown of this total by country and product respectively, based on the minimum ambition target.


